Home Bar Demographics
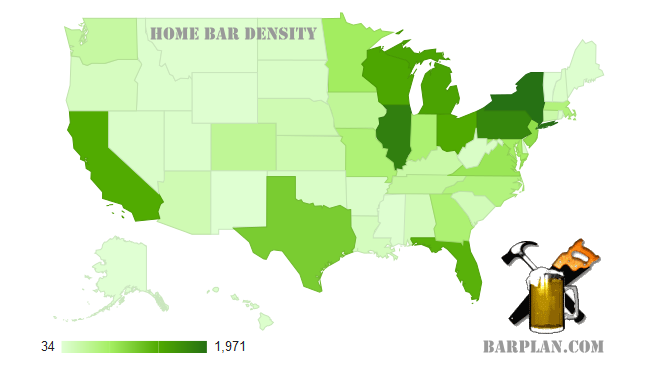
While reviewing our February 2013 site statistics, we did a search for demographics to show where home bars are generally concentrated. We figured someone with nothing better to do might find the figures useful or at the very least, interesting. It is interesting to actually visualize where and how many people are building private home bars across the country.
These numbers can give you a good idea of active home bars and do it yourself construction markets in your area over the past 30 days. We’ll watch the monthly figures and share them if we see a shift from current patterns. The green map is a nice St. Patty’s Day touch…

2-17-2013 Home Bar Density by location in the United States
Home Bars Nationwide
Globally, the top home bar concentration on the planet is dominated by the United States. Second places goes to Canada, third to Australia and the UK pulls up the rear at number four. Honorable mentions go to the Philippines, India, Germany, Denmark and South Africa in that order.
In the United states, New York leads the pack likely on population alone, followed closely by Illinois and Pennsylvania. Next are the notoriously hard partying Michigan and Wisconsin, along with Ohio, California, Florida, Texas and New Jersey.
The lowest concentration of home bars in the United States and presumably the crankiest people or lowest population areas were led by Vermont, then Alaska, New Mexico and Wyoming.
data source: barplan.com and our own Google Analytics data.
